
Armenia Import Export Data: Top Products, Partners and Global Data Trends

Armenia’s trade numbers have been on a wild ride over the past three years — a gold-driven boom in 2024, a sharp correction in 2025, and signs of a steadier recovery through 2026. For importers, exporters, and sourcing teams, this kind of shift in import export data signals where new opportunities and risks are forming. In this blog, you’ll see Armenia’s top traded products, its changing partner markets, and what the latest numbers through 2026 mean for businesses evaluating this market.
Armenia’s Global Data Trade Profile at a Glance
Armenia’s foreign trade turnover peaked at US$30.1 billion in 2024, up 41.5% from 2023, driven heavily by a surge in gold and gem re-exports. That boom cooled sharply in 2025: exports fell 36.1% to about US$8.4 billion, and imports dropped 23.6% to roughly US$13 billion, bringing total trade down to about US$21.4 billion, according to the National Statistical Committee of Armenia.
The latest data for 2026 shows a steadier picture. In the first eight months of 2026 (January-August), total trade turnover reached US$13.27 billion, up 3.2% year-on-year. Imports led the recovery, rising 9.3% to US$8.65 billion, while exports were still down 6.5% at US$4.62 billion over the same period. For sourcing and market-entry teams, the takeaway is that Armenia’s trade growth is no longer a straight line — it now moves in cycles tied closely to the precious metals trade.
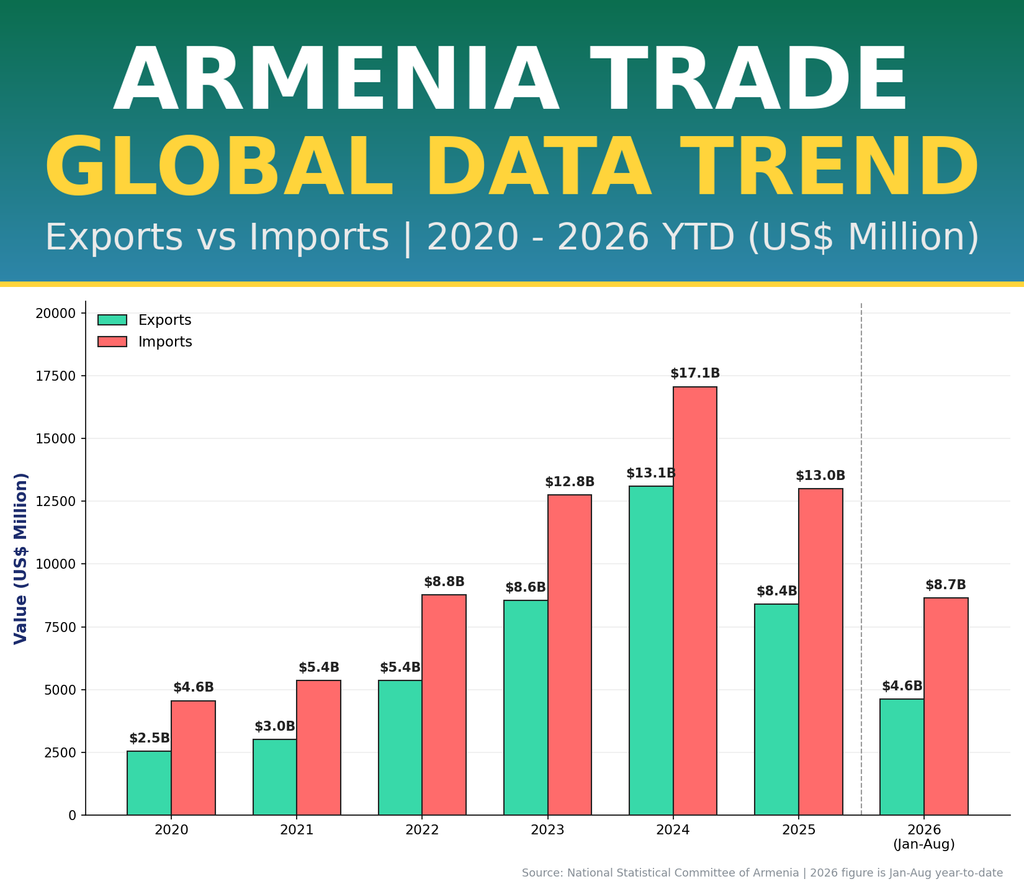
Fig 1: Armenia’s exports vs imports, 2020-2026 YTD
| Year | Exports (US$ Million) | Imports (US$ Million) |
| 2020 | 2,544 | 4,559 |
| 2021 | 3,023 | 5,357 |
| 2022 | 5,360 | 8,769 |
| 2023 | 8,552 | 12,758 |
| 2024 | 13,092 | 17,067 |
| 2025 | 8,400 | 13,000 |
| 2026 (Jan-Aug) | 4,624 | 8,650 |
What this means for business: 2024’s spike was mostly a gold re-export story, not broad-based economic growth, which is why it reversed so quickly in 2025. The 2026 year-to-date numbers suggest imports are normalizing faster than exports, a pattern worth watching for anyone pricing supply contracts into this market.
Top Export Products from Armenia
Armenia’s export basket is still led by precious metals and gems, though at a much smaller scale than the 2024 peak. Based on full-year 2025 figures, the following categories lead the country’s outbound shipments.

Fig 2: Armenia’s top export products by value, 2025
Precious and semi-precious stones and metals fell 64.5% year-on-year in 2025 to about US$2.8 billion, yet still remain the single largest export category. Mining products (including copper ore) grew 18.9% to US$1.3 billion, showing that the more traditional mineral export base is still expanding even as the gold re-export boom fades. Machinery, foodstuff, and vehicles round out the rest of the list at a smaller but steadier scale — useful categories for buyers looking for less volatile supply relationships.
Top Import Products of Armenia
On the import side, Armenia’s buying pattern is dominated by machinery, vehicles, and consumer-linked categories rather than raw materials. These figures reflect full-year 2025 data.

Fig 3: Armenia’s top import products by value, 2025
Machinery and equipment lead imports at US$2.62 billion, followed by transport means (vehicles) at US$1.0 billion, foodstuff at US$950 million, and chemicals at US$706 million. Early 2026 data (January-July) shows machinery imports up a further 37.7% and transport means up 38.2% year-on-year — a strong signal that industrial and consumer demand is rebuilding faster than the export side.
Key Trading Partners in Armenia’s Import Export Data
Partner-country data shows a real reshuffling happening. Russia regained its position as Armenia’s top export destination in 2025 at about 35% share (roughly US$2.9 billion), overtaking the UAE, which had briefly led in 2024. The UAE followed at around 25% (US$2.05 billion), with China, Hong Kong, and Iraq rounding out the next tier of buyers.
The bigger story is unfolding in 2026: Armenia’s economy minister reported that exports to the European Union rose around 70% in January-August 2026, exports to India more than doubled, and exports to the UAE grew by 45-46% — while exports to the Russia-led Eurasian Economic Union bloc declined, partly due to new Russian restrictions on Armenian goods.
For businesses, this kind of shift matters. Understanding this kind of partner-level import export data helps sourcing teams judge how exposed a supplier or buyer relationship is to a single country’s trade policy or currency swings.
Trends and Opportunities for Importers and Exporters
- Gold-driven volatility: Precious metals still dominate Armenia’s export mix, but the sharp 2024-to-2025 swing shows this category can move fast in both directions.
- Market diversification underway: Exports to the EU, India, and UAE are all growing strongly in 2026, while reliance on the EAEU bloc is shrinking — a trend worth tracking for freight and logistics planning.
- Imports recovering faster than exports: Machinery and vehicle imports are growing well into 2026, pointing to rebuilding industrial and consumer demand inside Armenia.
- Steady non-metal categories: Mining products, foodstuff, and machinery exports offer more predictable, less volatile entry points for new suppliers compared to the precious metals trade.
Businesses researching similar patterns across other markets can explore country-level trade summaries on the countries covered page for comparison.
Why Import Export Data Matters for Businesses
Reliable trade data does more than confirm what a country buys and sells — it shapes real business decisions. For sourcing teams, product-level data flags where demand is concentrated and where pricing power sits. For exporters, partner shifts like the EU and India’s rapid growth in 2026 reveal where new buyer relationships are forming first. For pricing and competitive strategy, tracking category-level swings — like Armenia’s gold-driven boom-and-correction cycle — helps businesses decide whether to enter a market early, wait for it to stabilize, or diversify away from a single volatile category.
In short, whether you’re evaluating a new supplier, planning a market entry, or benchmarking competitors, global data on trade flows turns guesswork into an informed, defensible strategy.
Conclusion: Explore Armenia’s Global Data Further
Armenia’s trade story has shifted from a gold-driven spike in 2024 to a correction in 2025 and a more diversified, steadier recovery through 2026. For businesses outside the precious metals trade, machinery, vehicles, mining products, and agri-based categories like brandy and wine offer more stable, less crowded opportunities. Having access to detailed, product-level and partner-level trade data makes all the difference between a guess and a plan.
Explore more country-level trade profiles and detailed product data at DataVault Insights to build your next sourcing or export strategy with confidence.