
Afghanistan Import Export Data: Top Products, Partners and Global Data Trends

Afghanistan’s trade landscape is shifting fast, and the latest numbers tell a story that every importer, exporter, and sourcing team should pay attention to. From a widening trade gap to a changing mix of buyer countries, the country’s import-export data offers real clues about where opportunity is opening up. In this blog, you’ll learn Afghanistan’s top traded products, its biggest partner countries, and what these numbers mean for businesses planning to source from or sell into this market.
Afghanistan’s Global Data Trade Profile at a Glance
Afghanistan remains a small but active player in global trade, with agriculture and mining goods forming the backbone of its outbound shipments. According to World Bank-sourced trade figures, Afghanistan’s goods exports reached close to US$880 million in 2024, a marginal rise from US$847 million in 2023. Imports, on the other hand, jumped sharply, climbing 40% year-on-year to nearly US$10.8 billion in 2024, up from US$7.8 billion in 2023.
This gap between imports and exports pushed the trade deficit to roughly US$8.9 billion in 2024, equal to about 44% of GDP, compared with US$5.6 billion (32% of GDP) the year before. For sourcing teams, this signals a market that is heavily import-dependent, which usually points to steady, ongoing demand for consumer and industrial goods.
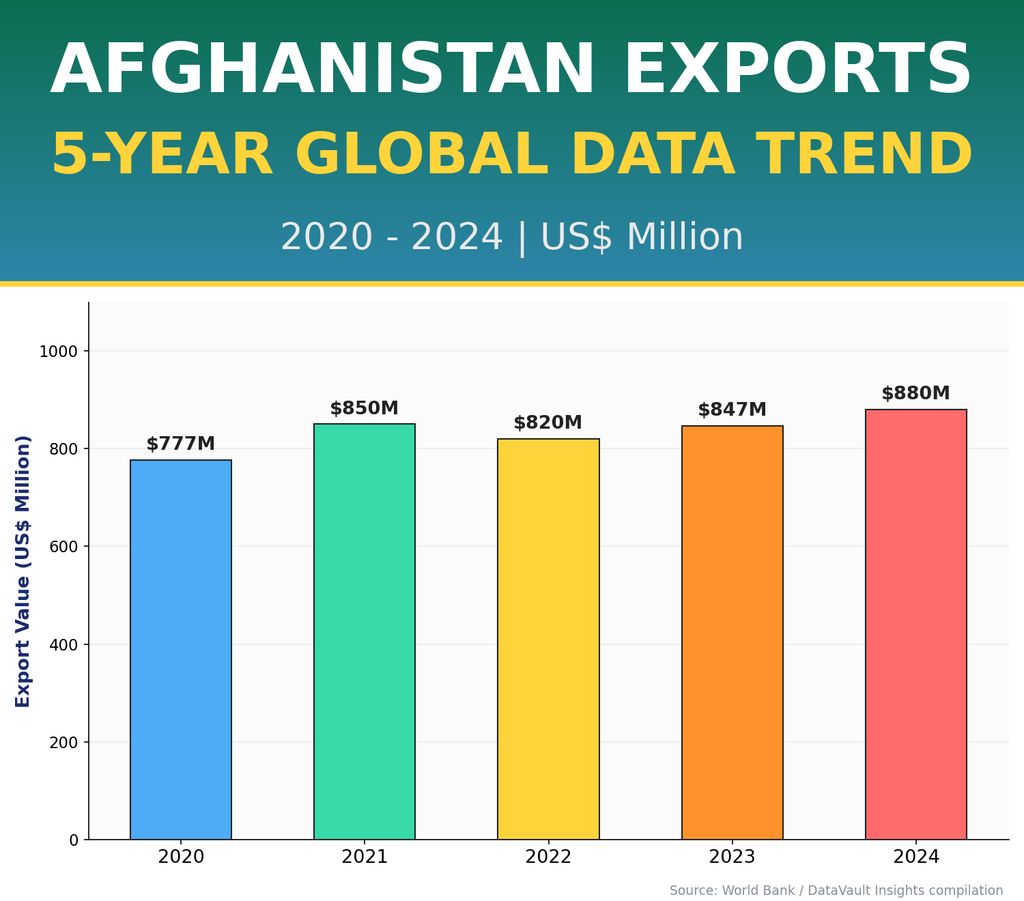
Fig 1: Afghanistan’s goods export value trend, 2020-2024 (Source: World Bank / DataVault Insights)
| Year | Exports of Goods (US$ Million) |
| 2020 | 777 |
| 2021 | 850 |
| 2022 | 820 |
| 2023 | 847 |
| 2024 | 880 |
What this means for business: export volumes have stayed fairly flat for four straight years, so exporters betting on Afghanistan as a growth market should look closely at specific product categories rather than the overall trade number, since growth is uneven across sectors.
Top Export Products from Afghanistan
Afghanistan’s export basket is dominated by agricultural produce, handicrafts, and raw materials — categories where the country has natural or traditional advantages. Based on 2024 product-level trade figures, the following items lead the country’s outbound shipments.
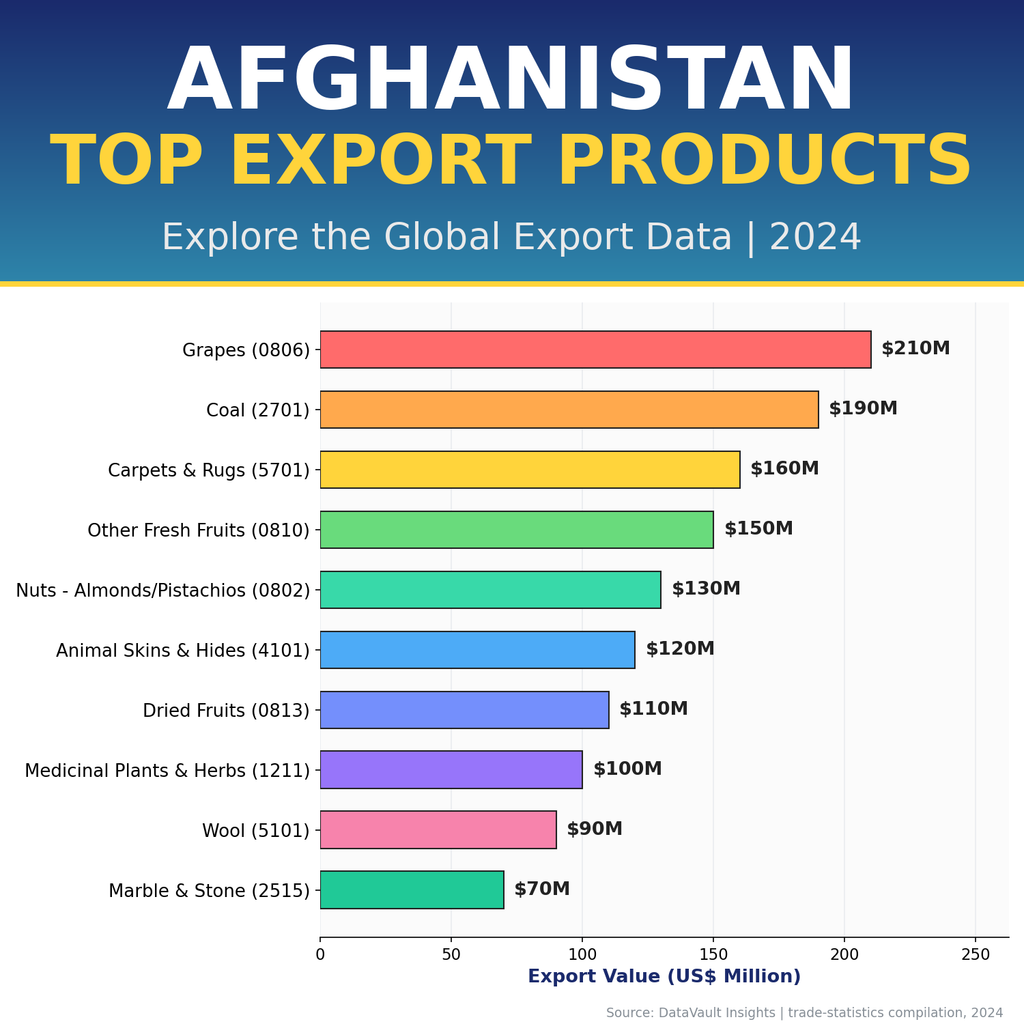
Fig 2: Afghanistan’s top 10 export products by value, 2024 (Source: DataVault Insights compilation)
For a buyer or sourcing manager, this chart is useful in two ways. First, fresh and dried fruit together account for close to a third of exports, so pricing and seasonal supply for these categories are worth tracking closely if you import agri-produce. Second, handmade carpets and wool show that traditional craft-based exports still hold real commercial weight, which matters for niche retail and speciality import businesses.
Top Import Products of Afghanistan
On the import side, Afghanistan relies heavily on fuel, food staples, and medicines — categories tied directly to daily consumption and basic infrastructure needs. Recent product-level figures show the following as the country’s leading imports by value.

Fig 3: Afghanistan’s top import products by value (Source: DataVault Insights compilation, latest available year)
For exporters and freight-forwarding businesses, this is a clear market-entry signal. Fuel, staple foods, and pharmaceuticals top the list, meaning suppliers of these goods — whether from neighbouring countries or further afield — have a consistent, recurring buyer base in Afghanistan. Vehicle exporters should also note that cars remain a steady import category despite the country’s smaller economy.
Key Trading Partners in Afghanistan’s Import Export Data
Partner-country data shows a clear shift happening in Afghanistan’s trade relationships. On the export side, Pakistan remained the top destination in 2024 at around 45% share, though this was down from 54% in 2023. India’s share rose to about 34%, driven largely by fruit and food exports, while Iran, Kazakhstan, and Uzbekistan each contributed roughly 3% as the country works to diversify its buyer base.
On imports, Iran became Afghanistan’s largest supplier in 2024, accounting for close to 30% of total imports — a rise of 84% compared to the previous year — as trade patterns shifted away from a heavier reliance on Pakistan amid tighter cross-border conditions and higher tariffs.
For businesses, this shift matters. Understanding this kind of partner-level import/export data helps sourcing teams time their market entry and negotiate better with local buyers.
Trends and Opportunities for Importers and Exporters
- Rising import demand: With imports up 40% in a single year, categories like fuel, food, and pharmaceuticals show consistent demand that new suppliers can tap into.
- Diversifying export markets: Afghanistan is actively spreading its exports beyond Pakistan, giving buyers in India, Central Asia, and the Gulf a growing supply base for fruit, nuts, and textiles.
- Traditional goods still lead exports: Carpets, wool, and medicinal herbs show that craft- and agri-based categories remain commercially strong, useful for speciality importers and retail brands.
- Widening trade deficit: A deficit near 44% of GDP means the country’s economy leans heavily on imported goods, a useful signal for logistics providers and trading companies planning long-term supply routes.
Businesses researching similar patterns across other markets can explore country-level trade summaries on the countries covered page for comparison.
Why Import Export Data Matters for Businesses
Reliable trade data does more than confirm what a country buys and sells — it shapes real business decisions. For sourcing teams, product-level data helps identify which suppliers are active and where pricing pressure is building. For exporters, partner-country shifts, like the Pakistan-to-India rebalancing seen in Afghanistan’s exports, reveal where new buyer relationships are forming. For pricing and competitive strategy, tracking yearly trends helps businesses time their entry before markets get saturated or costs rise.
In short, whether you’re evaluating a new supplier, planning a market entry, or benchmarking competitors, global data on trade flows turns guesswork into an informed, defensible strategy.
Conclusion: Explore Afghanistan’s Global Data Further
Afghanistan’s trade numbers for 2023-2024 point to a market with growing import demand, a diversifying export base, and clear category-level opportunities for fruit, textiles, fuel, and pharmaceuticals. For any business evaluating sourcing or market-entry decisions here, having access to detailed, product-level and partner-level trade data makes all the difference between a guess and a plan.
Explore more country-level trade profiles and detailed product data at DataVault Insights to build your next sourcing or export strategy with confidence.